Volumen 35, Nº 1 | 2017
Dinámica probabilista temporal de la epidemia de VIH/SIDA en los - Probabilistic temporal dynamics of HIV/AIDS epidemic in the United States
Javier Rodríguez Velásquez, MD, Signed Prieto, Dharma Rodríguez
Palabras clave: Epidemia, VIH, SIDA, Probabilidad, Predicción, Salud Pública.
Keywords: Epidemic, HIV, AIDS, Probability, Prediction, Public Health.
INTRODUCTION
AIDS is an important cause of morbility and mortality around the world. In 2009, the United Nations estimated that 33.3 million people worldwide were living with Human Immunodeficiency Virus type 1 (HIV-1) infection; during that same year, the number of annual AIDS-related deaths worldwide was estimated as 1.8 million [1.6 million–2.1 million] (1,2). Sub-Saharan Africa remains as the most severely affected region, with approximately 22.5 million infected in 2009 (2). According to UNAIDS epidemiological report, The United States has reported the highest number of infected in all countries; in North America there is an average of 1,500,000 people living with HIV and 26,000 deaths attributable to AIDS by the year 2009 (2). Despite the strategies implemented to prevent the disease, it remains a public health problem (2).
Probability is a mathematical measure that assesses the possibility of the occurrence of a given event in an experiment that can present a finite set of events (3-6); some of the fundamental theories, as quantum physics and statistical mechanics, express laws of nature with the calculus of probabilities. Since the HIV/AIDS epidemic is an irregular and complex phenomenon, it will be study from the theory of probability and the loading of probabilities for a better understanding of its dynamics and so make possible to predict the number of infected cases in future.
The application of acausal mathematical and physical theories in the study of the epidemics dynamics have allowed to predict the infected cases number in big populations as countries, and small ones as municipalities; it also have allowed predictions for annual periods or even for a given epidemiologic week. For example, the prediction about the trajectory of the Malaria epidemic for the years 2005, 2006 and 2007 by calculating the speed and acceleration, the usage of second-order differential equations and the representation in polar coordinates by means of using concentric circular attractors (7). Another characteristic example is the prediction of Malaria outbreaks in periods of weeks for Colombia’s municipalities, through the application of probability, entropy and entropy / Boltzmann constant relation (S/k) (8). Based on random walk a prediction about the Dengue epidemic in Colombia was made for the year 2007, obtaining a value that corresponds to the 90.4% with respect to the real infected number reported (9). It was also made a prediction about the annual infected number in Colombia of epidemics as Malaria (10) and Dengue (11), based on the load of probabilities in bounded time ranges, with a success percentage over 90% in both cases.
From this perspective, it is possible to assess whether the ranges, seen as events of a sample space, are equally probable or not, by using the mean quadratic deviation (4). The study of the dynamics of HIV/AIDS epidemic will allow making predictions for the HIV/AIDS cases number in the United States for 2006.
In this work, we will apply previously methodology applied to the malaria (10) and dengue (11), epidemic, thus the dynamics of HIV/AIDS epidemic will be characterized in an objective and reproducible way, establishing the quantitative probabilistic behavior of the increase or decrease of the cases number per year and predicting the infected number of VIH/AIDS for 2006 year.
DEFINITIONS
Probability of a range: The probability of a range is defined as the number of frequency of times that the total number of annual infected in United States has been contained in this range, divided between the total of frequencies that corresponds to the total of years.
Mean quadratic deviation of a range: To study if a group of ranges is equally probable or not, which means if there is a loading of the probability for specific events of the sample space, the formula of deviation equally probable is used4:
Where N is the number of events of the sample space, this is the total of frequencies.
METHODOLOGY
The values reported by the U.S. Health institute for the annual cases number of HIV / AIDS from 1981 to 2005 were grouped in ranges of 2.500 and 1.500 infected. These ranges were analyzed through a space of probability construction for each of the defined range types, where the presentation of each specified range is considered as an event. Based on the space of probability, the probability of occurrence of each event is established (see definitions).
This space of probability quantifies the possibility of a recorded total value for the HIV/AIDS infected number for a specific year in The United States, to be included in the established ranges. The range’s extension was chosen considering that the annual variation of the infected number for the last years, with respect to the year of prediction, was close to these ciphers.
Then, probability spaces that quantify sets of ranges of 2,500 grouped in three were defined, so as sets of ranges of 1,500 grouped in four. The conformation of those sets was done in this way, given that since 1998 the epidemic tended to stabilize, and the annual variability of the defined ranges was three and four respectively. In these spaces the probability was calculated for each range with respect to the total set. The mean quadratic deviation of each range was also determined in order to establish if it exists or not a loading of the ranges, through the subtraction of the probability and its mean quadratic deviation. Finally an arithmetic average of the numbers that name the ranges of the last three years was made, and the range of infected number that correspond to the average value was established by a rule of three.
RESULTS
The minimum ranges of annual infected in the period 1981-2005 was 1 in both ranges, of 2.500 and of 1.500, corresponding to an infected number that varies from 0 to 2.500 and from 0 to 1.500 respectively. The highest number of infected was 32 for the ranges of 2.500 and was 54 for the ranges of 1.500, belonging to an infected number that varies from 77,500 to 80,000 and from 78,500 to 80,000 respectively.
The frequency values of ranges occurrence were between 0 and 6, and the probability values were between 0 and 0.24 for ranges of 2,500 (Table 2). The frequency values of ranges occurrence and ranges probability for ranges of 1,500 are not shown, but they respectively were between 0 and 3, and between 0 and 0.12
It was found that the probability values for sets of 4 ranges groups varied in the interval [0 – 1.00]; the values of mean quadratic deviation for these sets varied between [-0.5 – 1.50], finding that the differences between them and the probability value (expected value) vary in the interval [-0.50 to 0.50] (Table 3).
It was found that the minimal value for the calculated differences for the 2,500 and 1,500 ranges sets were associated to a set that contains the ranges 16 to 18 and 25 to 28, for each ranges set respectively; the last ones are those that precisely contain the last five years, demonstrating so the loading of probabilities in time in this ranges set and it justifies the using of probabilities in this interval of time in order to predict the epidemic dynamics.
The obtained values of infected number that correspond to the years 2003, 2004 and 2005, for the ranges of 2,500 infected were in the range 16, while for the ranges of 1,500 infected were in the ranges 27 and twice in 26. The average evaluation of these values showed for 2006 that in the ranges of 2,500 corresponds to 16 and in the ranges of 1,500 to 26.33 (Table 4).
Values that was later corroborated with the diagnoses of HIV Infection in The United States, by year of diagnosis and selected characteristics, reported by the Center for Disease and Control and Prevention (Atlanta) according to “HIV/AIDS Surveillance Report 2009”, where infected number corresponding to year 2006 was 39 329, finding that the prediction was 100% accurate in both cases.
DISCUSSION
This is the first work in wish it is make a prediction of the cases number of the HIV/AIDS epidemic in The United States based on the ranges of the last three years, which is independent of causal factors. When the behavior of the epidemic is considered as a dynamic system, the probability theory application reveals a self-organization that allows to do temporal predictions, that may facilitate decision-making in Public Health. This methodology was originally developed for the Malaria epidemic in Colombia (10); it has been demonstrated its applicability to the Dengue epidemic (11), and in this study to the VIH/AIDS epidemic in The USA, results that suggest its generalization for other epidemics.
It have been developed mathematical models on the HIV/AIDS; most of them use statistical analysis across multivariate regression and make predictions with iteration nonlinear methods (12), others use computer models to make projections of the epidemic (13) and other are based on exponential models (14-16).
According to the calculation of the mean quadratic deviation to the probability values in chosen periods, it was revealed that the HIV epidemic dynamics has a kind of “probabilistic inertia”, which means that there is a loading of probabilities. Giving support to the evaluation of the HIV epidemic when recent years are taken, because these values are within limited values and none of them deviates considerably from the expected value. The predicted value was compared to the actual cases number reported by the Atlanta’s CDC (Center for Disease and Control and Prevention) (17), and it was determined the success degree of the prediction about the range in which the infected number will be, finding that it was 100%.
This work was based on the records of the Department of Health and Human Services of The United States, which before 2006 does not had exact methodologies to estimate the infected number, presenting so a sub-registration (18-19). The CDC has revealed that the historical trend analysis suggests that the annual number of new infections was never lower than 40,000 and that it has been more or less stable since the 1990 decade (20). A work of Hall H. et al., showed that in 2006 the HIV infected number was 56,300, number that is substantially higher than the previous estimates of 40,000 annual new infections (21).
The application of Physical and Mathematical theories also have been allowed to advance on the solution of another related problems to the human health. In this way, it has been developed characterizations and predictions in the immunology and molecular biology area, useful for the vaccines development. Some of them, are stand out the development of a predictive theory about the malaria peptides binding to HLA class II (22) and the creation of a theory for the prediction of binding peptides to Red Blood Cells, which results show a sensibility of 95% and a specificity of 90% (23). These theories also make possible predictions of CD4 lymphocytes’ count in HIV patients from complete blood count (24). It has been made morphometric characterizations and diagnostics to the health and sick prototypes differentiation of cells as erythrocytes (25), cervical epithelial cells (26-28), and coronary arteries in an animal experimental model (29). In cardiology field, diagnostic methodologies and predictions have been developed for cardiac dynamic (30-34), and predictions in the Intensive Care Unit (35).
This work is a temporal limited prediction, unlike that made for 820 municipalities in Colombia (8), which was an accurate prediction in time and space, calculated for weeks. Nevertheless the prediction developed in this study is also important because can make annual predictions in a precise way.
ACKNOWLEDGEMENTS:
This article is product of the Project Evaluación física y matemática de variables hemodinámicas de pacientes de la Unidad de Cuidados Intensivos fundamentada en la geometría fractal y los sistemas dinámicos: Cuantificaciones de aplicación clínica en 14 horas, developed in the Center of Investigations of the Country Clinic, in Alliance with the Universidad Militar Nueva Granada.
We thank the Universidad Militar Nueva Granada, for their support to our investigations. Specially to the Vice-Rectory of research and the Medicine Faculty. We extend a special thank to the Doctor Nydia Alexandra Rojas, Director of Research on the Medicine Faculty, to the Doctor Jorge Luque, Dean of the Medicine Faculty, to the Doctor Yanneth Méndez, Academic Vice-Rector and to the Eng. Marcela Iregui, Vice-Rector of Researchs.
We also thank the Center of Investigations of the Country Clinic, specially to the Doctors Tito Tulio Roa, Director of Medical Education, Jorge Ospina, Medical Director, and Alfonso Correa, Director of the Research Center; to the Doctor of the Center Adriana Lizbeth Ortiz, epidemiologist, the nurse Silvia Ortiz, for their support on our researchs.
DEDICATION:
To my children.
There is no conflict of interests
Bibliografía
1. Cohen M, Shaw G, McMichael A, Haynes B. Acute HIV-1 Infection. N Engl J Med 2011; 364: 1943-54.2. WHO, UNAIDS. Joint United Nations Programme on HIV/AIDS. Report on the Global AIDS epidemic 2010. p. 18 [Internet] [Updated 2010]; [Cited 2011 Julio 12]. In: http://www.UNAIDS.org
3. Laplace Pierre. Ensayo filósofico sobre las probabilidades. Barcelona: Altaya; 1995.
4. Feynman RP, Leighton RB, Sands M. Probabilidad. En: Feynman RP, Leighton RB, Sands M. Física. Vol. 1. Wilmington: Addison-Wesley Iberoamericana, S.A.; 1964. p. 6~1 - 6~16.
5. Mood A, Graybill F, Boes D. Introduction to the theory of statistics. 3rd ed. Singapore: Mc. Graw-Hill; 1974.
6. Blanco L. Probabilidad, notas de clase. Universidad Nacional de Colombia. Departamento de Matemáticas y Estadística; 1996.
7. Rodríguez J, Prieto S. Dinámica de la epidemia de Malaria. Predicciones de su Trayectoria. Rev Med 2010; 18(2): 12-20.
8. Rodríguez J. Método para la predicción de la dinámica temporal de la malaria en los municipios de Colombia. Rev Panam Salud Pública 2010; 27(3): 211-8.
9. Rodríguez J, Correa C. Predicción temporal de la epidemia de dengue en Colombia: dinámica probabilista de la epidemia. Rev Salud Pública 2009; 11(3): 443–53.
10. Rodríguez J. Dinámica probabilista temporal de la epidemia de malaria en Colombia. Rev Med 2009; 17 (2): 214-21.
11. Rodríguez J, Vitery S, Puerta G, Muñoz D, Rojas I, Pinilla L, et al. Dinámica probabilista temporal de la epidemia de dengue en Colombia. Rev Cubana Hig Epidemiol.2011; 49(1)
12. Löytönen M, Arbona SI. Forecasting the AIDS epidemic in Puerto Rico. Soc Sci Med 1996; 42(7): 997-1010.
13. Ding Y Computing back-calculation estimates of AIDS epidemic. Stat Med 1995; 14(14): 1505-12.
14. Stillman, G., & Stacey, K. Designing an applications task for Mathematical Methods using AIDS data. In: C.Vale, J. J. Roumeliotis, & J. Horwood (Eds.). Valuing mathematics in society, Proceedings of the 39th Annual Conference of the Mathematical Association of Victoria. Melbourne: Mathematical Association of Victoria; 2002. p. 470-480.
15. Fazekas de St Groth C, Solomon PJ. Short-term prediction of the AIDS epidemic using empirical models. In: P. J. Solomon, C. Fazekas de St Groth, & S. R. Wilson (Eds.), Projections of acquired immune deficiency syndrome in Australia using data to the end of September 1989. Canberra, ACT: Australian National University, National Centre for Epidemiology and Population Health. Working Paper No. 16 1990. p. 11-17)..
16. Solomon PJ, Doust JA, Wilson SR. Predicting the course of AIDS in Australia and evaluating the effect of AZT: A first report (Working Paper No. 3). Canberra, ACT: Australian National University, National Centre for Epidemiology and Population Health; 1989.
17. Department of Health and Human Services. Public Health Service. Centers for Disease Control and Prevention- Atlanta, Georgia. HIV Surveillance Report. Diagnoses of HIV Infection and AIDS in the United States and Dependent Areas, 2009, Vol 21. Table 1a: Diagnoses of HIV infection, by year of diagnosis and selected characteristics, 2006–2009—40 states with confidential name-based HIV infection reporting.
18. Department of Health and Human Services. Public Health Service. Centers for Disease Control and Prevention- Atlanta, Georgia. HIV/AIDS Surveillance Report. U.S. HIV and AIDS cases reported through December 2001 Year-end edition Vol. 13, No. 2. Table 21: AIDS cases and deaths, by year and age group, through December 2001, United States.
19. Department of Health and Human Services. Public Health Service. Centers for Disease Control and Prevention- Atlanta, Georgia. HIV/AIDS Surveillance Report. Cases of HIV infection and AIDS in the United States and Dependent Areas, 2006, Vol. 18. Table 3: Estimated numbers of AIDS cases, by year of diagnosis and selected characteristics, 2002–2006 and cumulative—United States and dependent areas.
20. Department of Health and Human Services. Public Health Service. Centers for Disease Control and Prevention. HIV Incidence. In http://www.cdc.gov/hiv/topics/surveillance/index.htm. July 5, 2011.
21. Hall H, Song R, Rhodes P, Prejean J, Lee L, Karon J, Brookmeyer R, Kaplan E, McKenna M, Janssen R. Estimation of HIV Incidence in the United States. JAMA 2008; 300 (5): 520-9.
22. Rodríguez J, Bernal P, Prieto P, Correa C, Álvarez L, Pinilla L, et al. Predicción de unión de péptidos de Plasmodium falciparum al HLA clase II. Probabilidad, combinatoria y entropía aplicadas a las proteínas MSP-5 y MSP-6. Archivos de alergia e inmunología clínica. 2013; 44(1): 7-14.
23. Rodríguez J, Bernal P, Prieto S, Correa C .Teoría de péptidos de alta unión de malaria al glóbulo rojo. Predicciones teóricas de nuevos péptidos de unión y mutaciones teóricas predictivas de aminoácidos críticos. Inmunología. 2010; 29(1):7-19.
24. Rodríguez J, Prieto S, Correa C, Mora J, Bravo J, Soracipa Y, et al. Predictions of CD4 lymphocytes’ count in HIV patients from complete blood count. BMC Medical Physics. BMC Medical Physics. 2013; 13:3.
25. Correa C, Rodríguez J, Prieto S, Álvarez L, Ospino B, Munévar A, et al. Geometric diagnosis of erythrocyte morphophysiology: Geometric diagnosis of erythrocyte. J. Med. Med. Sci. 2012; 3(11): 715-720.
26. Prieto S, Rodríguez J, Correa C, Soracipa Y. Diagnosis of cervical cells based on fractal and Euclidian geometrical measurements: Intrinsic Geometric Cellular Organization. BMC Medical Physics 2014, 14(2):1-9.
27. Rodríguez J. Nuevo método fractal de ayuda diagnóstica para células preneoplásicas del epitelio escamoso cervical. Rev UDCA Act & Div Cient. 2011; 14(1):15-22
28. Rodríguez J, Prieto S, Correa C, Dominguez D, Cardona DM, Melo M. Geometrical nuclear diagnosis and total paths of cervix cell evolution from normality to cancer. J Can Res Ther 2015; 11(1): 98-104.
29. Rodriguez J, Prieto S, Correa C, Bernal P, Puerta G, Vitery S, et al. Theoretical generalization of normal and sick coronary arteries with fractal dimensions and the arterial intrinsic mathematical harmony. BMC Medical Physics 2010; 10:1-6.
30. Rodríguez-Velásquez J, Prieto S, Domínguez D, Correa C, Melo M, Pardo J, et al. Application of the chaotic power law to cardiac dynamics in patients with arrhythmias. Rev. Fac. Med. 2014;62(4):539-46.
31. Rodríguez J, Prieto S, Correa C, Mendoza F, Weiz
G, Soracipa Y, et al. Physical mathematical evaluation of the cardiac dynamic applying the Zipf – Mandelbrot law. Journal of Modern Physics
2015, 6: 1881-1888. http://dx.doi.org/10.4236/jmp.2015.613193
32. Rodríguez J, Prieto S, Domínguez D, Melo M, Mendoza F, Correa C, et al. Mathematical-physical prediction of cardiac dynamics using the proportional entropy of dynamic systems. J. Med. Med. Sci. 2013; 4(8): 370-381.
33. Rodríguez J, Prieto S, Bernal P, Izasa D, Salazar G, Correa C, Soracipa Y. Entropía proporcional aplicada a la evolución de la dinámica cardiaca. Predicciones de aplicación clínica. En: Rodríguez LG, Coordinador. La emergencia de los enfoques de la complejidad en América Latina: desafíos, contribuciones y compromisos para abordar los problemas complejos del siglo XXI. Tomo 1,1a ed. Buenos Aires: Comunidad Editora Latinoamericana; 2015. p. 315-44.
34. Rodríguez J, Prieto S, Flórez M, Alarcón C, López R, Aguirre G, et al. Physicalmathematical diagnosis of cardiac dynamic on neonatal sepsis: predictions of clinical application. J.Med.Med. Sci.2014; 5(5): 102-108.
35. Rodríguez J. Dynamical systems applied to dynamic variables of patients from the Intensive Care Unit (ICU). Physical and mathematical Mortality predictions on ICU.J.Med.Med. Sci. 2015; 6(8): 102-108.
Imágenes

Ecuación P (r)

Ecuación P (Rn)
Tabla 1
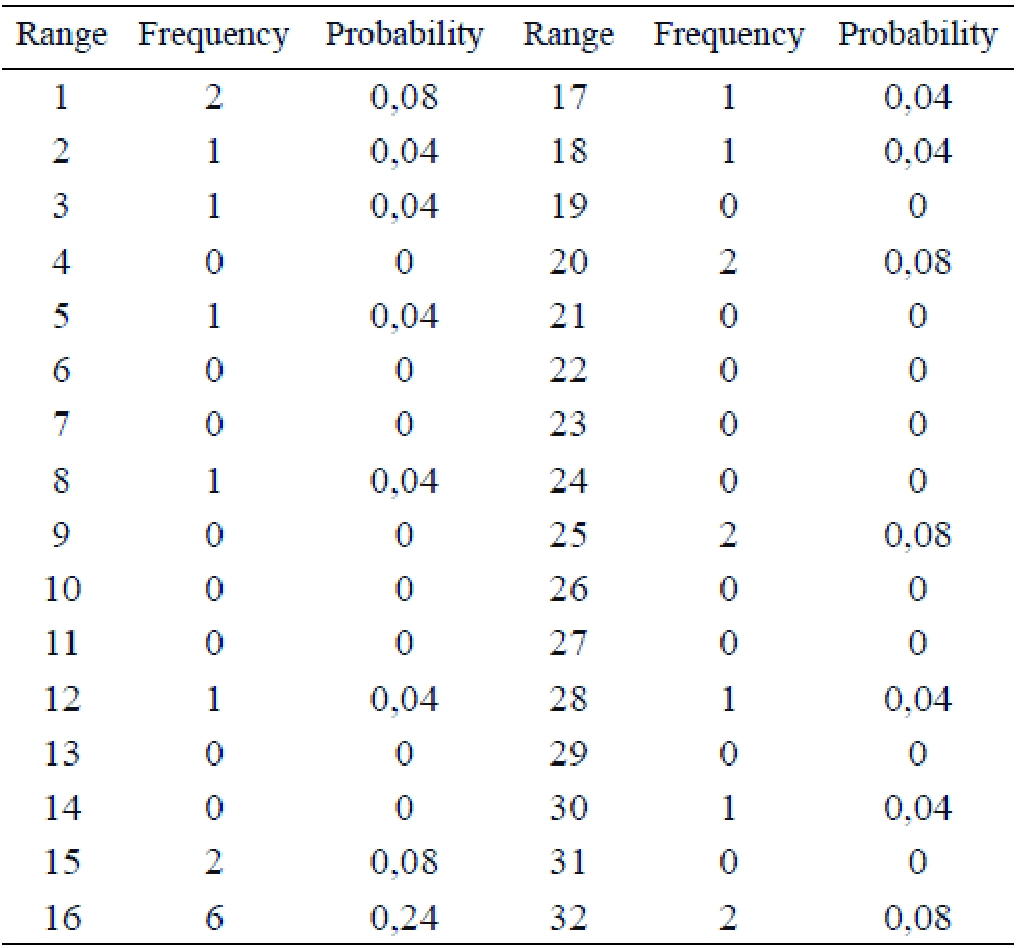
Tabla 2

Tabla 3
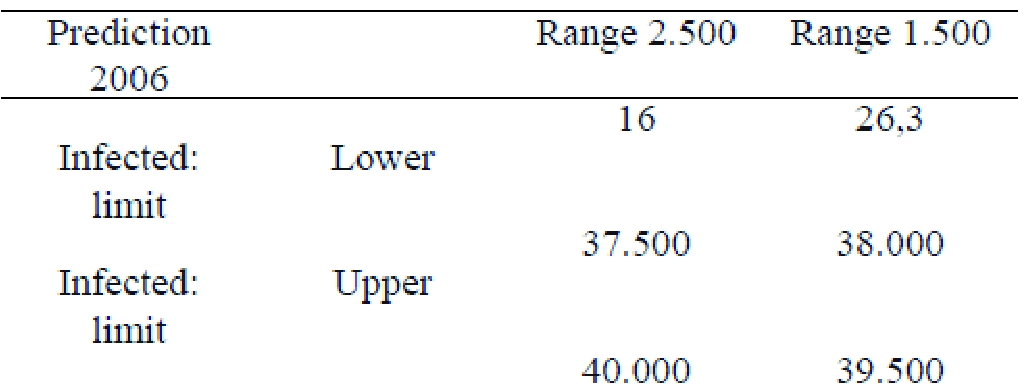
Tabla 4